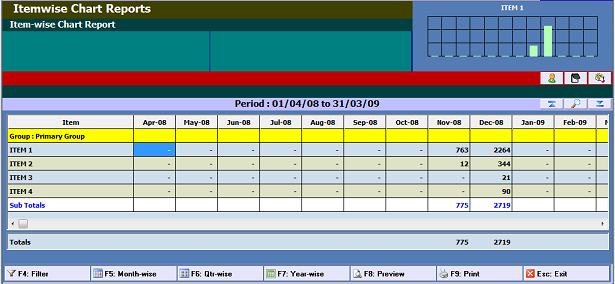
Item chart report views the graphical representation of issue/receipt of
items. To do so, click on 'Reports' -> 'Items Charts' button from side
button bar. First it prompt you to select the Period. You may select the
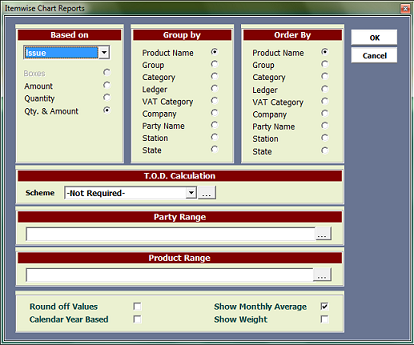
multiple years period. After selecting period it shows the following screen:
Here in the above screen, you may specify that the report is based on
receipt/issue. You may also specify that the report shows Amount,
Quantity, Boxes and Qty. & Amount.
Note: Here boxes counts Number of boxes (NoOfBoxes) field from a
document
You may also specify group by/order by fields and party/product range can
be selected for this report by selecting relevant option.
You may view the graphical representation of data by selecting a row. You
may view month wise/quarter wise/year wise report by clicking on the
relevant button from bottom button bar. You may filter the records by
clicking on 'F4: Filter' button.